


Project: Food Me
PROJECT BACKGROUND
The purpose of this study was to examine if presenting the ingredient list for menu items could benefit people who have dietary restrictions. In addition, it investigates if user experience and consumer trust have a relationship in the context of ordering food using a digital menu.
This research project was presented as my dissertation for concluding a Master’s Degree in Media Innovation. The theme of the investigation was inspired by the struggle of close friends with special dietary needs in finding food options that match their needs, particularly when they are ordering food online.
The problem
People with dietary requirements face many challenges when ordering food, particularly due to the lack of sufficient information on menus. The problem is exacerbated when ordering online.
The goal
It was hypothesised that listing the ingredients of menu items while allowing personalisation according to dietary types can offer a positive user experience for individuals with dietary requirements. Additionally, it is argued that consumer trust is associated with one’s expectations regarding the information on a menu.
The goal of the project is to investigate such claims and propose recommendations for the industry and future research.
My role
Naturally, as this is my own dissertation, I combined the roles of project lead and researcher. My responsibilities included:
- Project management
- Research design
- Design and implementation of the prototype
- Conducting interviews
- Conducting usability studies
- Analysing data sets
Tools used in this project
- Figma
- IBM SPSS
- Google Sheets
- Photoshop
/* MENU */
- How I approached the project
- The Literature Review
- The Research Design
- Results
- Conclusions
- What I learned
HOW I APPROACHED THIS PROJECT
I wanted to lead this project similarly to how I approach my daily work, by working with an iterative approach. As many of my friends have some sort of dietary requirements, I was already familiar with the struggles of finding food appropriate to their needs. Particularly, I do not eat meat for many years, and I try to abstain from animal products as well. Therefore, the idea for the research topic came from the proposal that by disclosing the ingredients list of dishes, it would be easier to connect meals to special diets.
However, as I have a personal interest in the topic, I was aware that my results and conclusions could be driven by biases. For this reason, I found that a mixed-method approach was the most appropriate manner to conduct the research. Initially, I intended to perform interviews and focus groups as qualitative measures, alongside a questionnaire so that I could generalise the results. However, focus groups were proven not to be an optimal method in this situation, as many people are uncomfortable discussing their needs in front of others. The final research design was then a combination of semi-structured interviews and a survey containing the prototype of a digital menu.
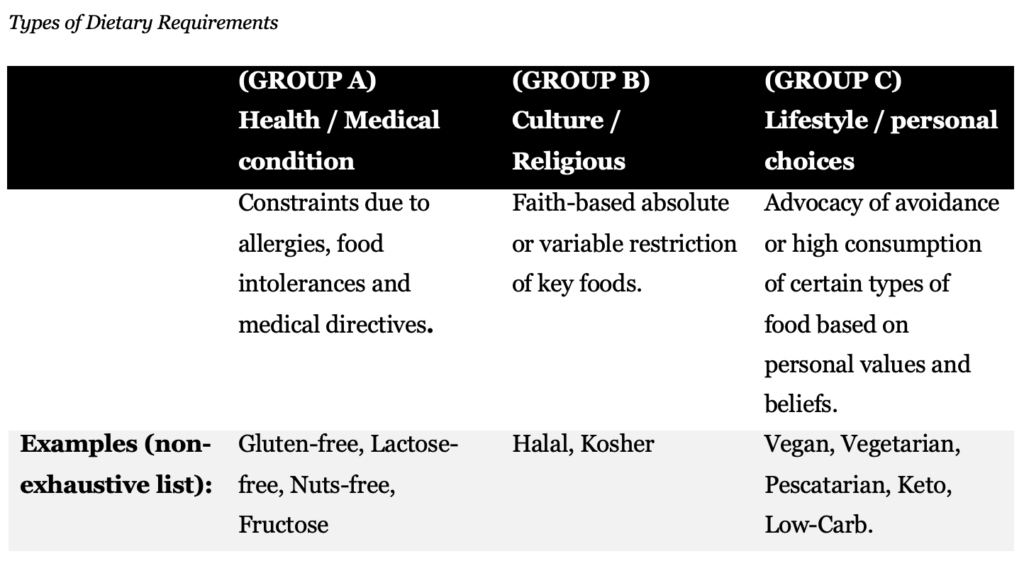
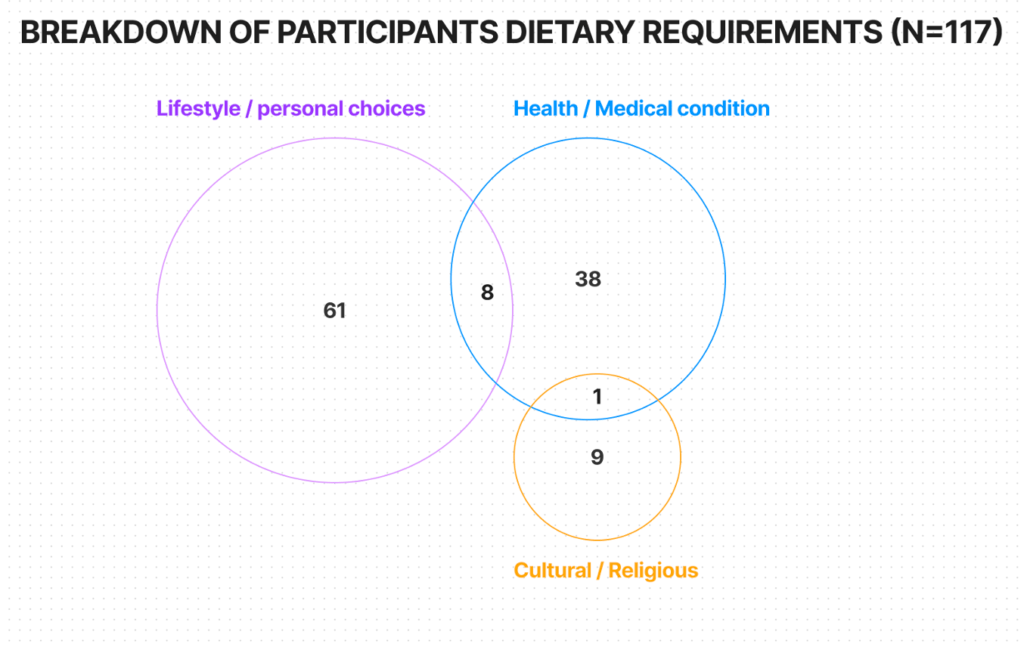
I started with a comprehensive literature review on topics related to dietary needs and information on menus. I found out that food restrictions can be classified under three main “umbrellas”: health conditions, religion / culture and lifestyle / personal beliefs. Based on this, I was interested in knowing if these groups would have differences in needs. Moreover, I discovered that there is a lot of research on the value that descriptive menus can provide to businesses, but a little investigation into the needs of consumers, particularly those who have special dietary concerns. At the same time, it was not clear whether a good experience with a menu was connected to consumer trust in these groups. Trust is an essential component in any business, even more so when we are thinking about food.
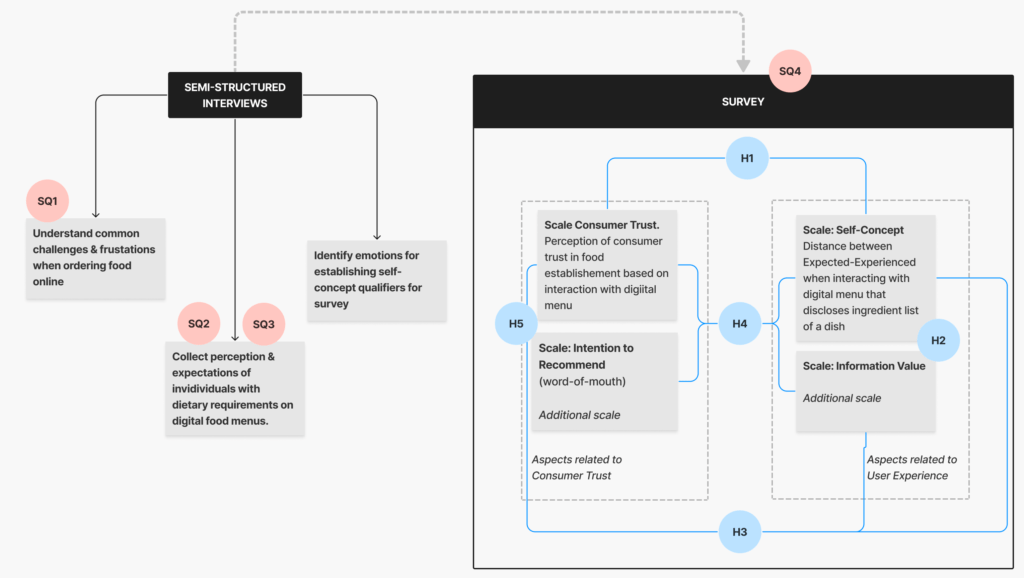
So from this point, I went to draw the framework for my research. I decided on measures for Consumer Trust and User Experience. I set some subquestions and hypotheses. And I moved on to find participants for the first set of interviews. My idea was that with the interviews I could check if insights I found in the literature review were pertinent to the groups I was investigating while identifying common challenges they face when ordering food online. At the same time, insights from the interviews would allow me to decide on a set of qualifiers that would be used in the survey as part of the method called Self-Concept, which was one of the measures used for measuring UX.
With the insights of the interview summarised, I saw that it would make sense not only to add the list of ingredients to the digital menu to be tested but also to include a label for the type of diet selected by the individual interacting with the menu. This way, I would be testing the prototype made with learnings from groups with dietary needs with a wider audience and so, allowing me to generalise results. Naturally, I had a few “rounds of review” in the original set of subquestions and hypotheses.
Once these steps were performed, I moved on with the analysis of the survey data – and that’s my favourite part, as I loved to dig into the numbers ???? ???? But I must say combining the learnings from both the qualitative and quantitative parts was also very joyful, like putting pieces of a puzzle together!
THE LITERATURE REVIEW
The literature review brings a summary of standards and trends in the food industry. Next, I explored the use of a framework to classify different types of dietary needs so differences in answers could be compared between groups. After, I defined the concepts of Consumer Trust and User Experience, which are pertinent to the scope of the project. The summary of the literature review follows:
- Catering for individuals with special dietary needs has become a central point of concern for the hospitality and tourism industries, (Ogawa et al., 2012; Oktadiana et al., 2020) however the number of restaurants that disclose detailed information about ingredients and allergens is still very limited (Bryan Endres et al., 2020), particularly when buying online, which might restrict meal options of people with special diets unnecessarily.
- People with dietary requirements struggle in finding food options that match their needs as information on menus is little or absent. Moreover, they experience high levels of discomfort when they need to enquire restaurant staff about ingredients (Barnett & Vasileiou, 2014; Hamshaw et al., 2017; Leftwich et al., 2010)., with staff often unable to answer questions.
- Regulations on the disclosure of allergens exist in certain countries, however, they leave to the discretion of the restaurant how the information should be provided. This type of information is still not defaulted in most menus.
- Even when labels for allergens are present, they still lack clarity. Moreover, they do not necessarily answer the needs of a growing number of diets.
- Due to the described situation, individuals with special diet concerns have difficulty finding restaurants in which they can trust to have a meal.
- At the same type, there is evidence that descriptive menus can lead to a business’s financial gains by their association with consumer satisfaction, repurchase and intention to recommend (Chu et al., 2014; Fakih et al., 2016; Wansink & Love, 2014).
- Younger audiences are more likely to have special diet needs, with 45% of Millennials following a specific diet. At the same time, Millennials and Gen-Z represent the biggest group of consumers who order food online.
- The types of diets investigated in this project were classified by the framework proposed by Oktadiana et al. (2020):
Measuring Consumer Trust
Consumer trust is critical for food businesses, particularly for audiences with dietary restrictions. People want their food choices to be safe for their diets when they decide to buy and consume a meal. Consumer Trust was measured by relevant items from the Trust Toolkit (Benson et al., 2020), as this scale has been devised to deal with different aspects of trust concerning food businesses.
At the same time, word-of-mouth, or Intention to Recommend, can also be considered an indication of trust. Therefore both scales are utilised for understanding one’s experience in terms of Consumer trust.
Measuring User Experience
Evidence shows that one’s digital interaction with a brand can shape their perception of the business (Kaplan, 2016; Robier, 2015). At the same time, “brands that choose to address an unmet user need at the core of their business are regularly disrupting industries by focusing on UX and, specifically, on unmet user needs as brand differentiators” (Kaplan, 2016). Therefore, by providing a good user experience organisations can potentially increase their financial gains.
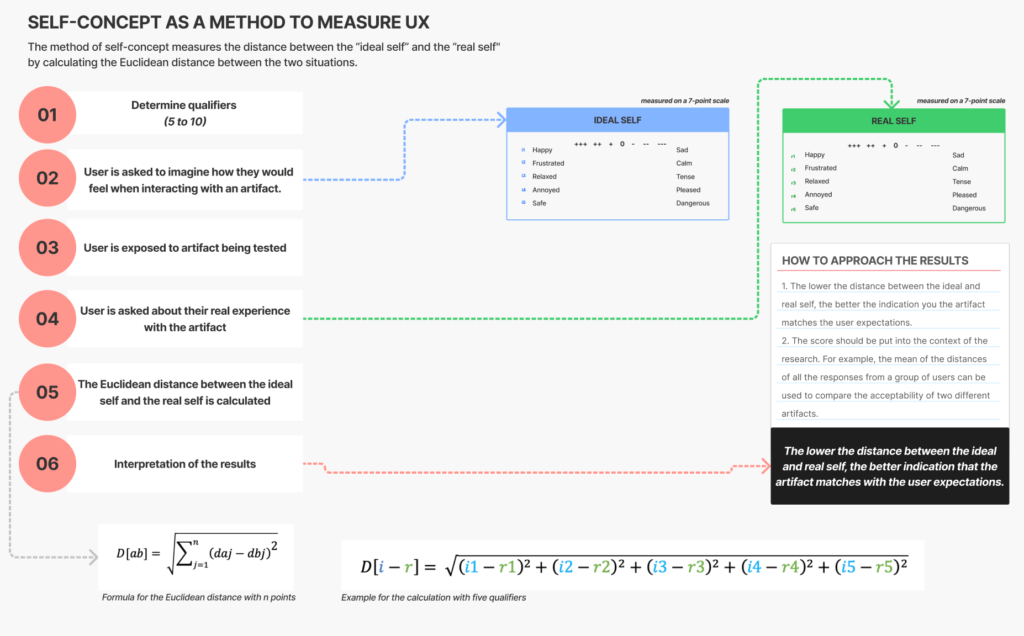
In this study, UX is measured under two different concepts. The first method to measure UX chosen was the Self-Concept (Rosenberg, 1989). This method differs from common usability and heuristic studies because it moves to a paradigm that the most important aspect of UX is how well an artefact matches the expectations of a user. For this matter, it measures the distance between how the user expects to feel about interacting with a certain digital product, and their real experience after interacting with the product. The distance is measured based on a pre-determined list of qualifiers, and it is calculated using the Euclidian distance formula.
Another aspect pertinent to user experience is the information value provided by being able to check the ingredients in a dish. For this reason, an additional scale for measuring Information Value has been applied to encapsulate this aspect of the user experience.
THE RESEARCH DESIGN
MAIN QUESTION: How are digital menus that disclose dishes’ ingredients and allow personalisation are experienced by young individuals with dietary requirements?
SUB-QUESTIONS
SQ1: What types of challenges do young individuals with dietary requirements experience when ordering food?
SQ2: How do young people with dietary requirements describe their expectations regarding information disclosed in digital menus?
SQ3: How do young individuals with dietary requirements describe their expectations concerning a digital menu that lists dish ingredients?
SQ4. How do young individuals evaluate their experience when using a digital menu that lists the ingredients of a dish while allowing personalization according to diet types?
SQ5: Are there differences in responses between the groups representing the three types of dietary requirements investigated in this research?
HYPOTHESES
The following hypotheses are created to answer sub-question SQ4:
H1: A digital menu that conforms to consumers’ expectations will positively influence consumers’ trust in a food establishment.
H2: Self-Concept and Information Value (IV) have a statistically significant relationship.
H3: Self-Concept and Information Value are strong predictors of Consumer Trust.
H4: Intention to Recommend can be predicted by Self-Concept, Information Value and Consumer Trust.
H5: Intention to Recommend and Consumer Trust have a strong positive association.
The Methodology
The methodology of the study followed a mix-method approach so as to be able to offer “more comprehensive, insightful and logical results” (Greene & Caracelli, 1997, p.10). The research design was implemented as an iterative process. With the definition of the problem and the creation of the hypothesis, a set of interview questions was created to collect additional insights into the challenges individuals face when ordering food online. At the same time, insights from this step contributed to the design of survey measures and additional features for testing a prototype. Next, a survey containing the prototype of a digital menu was distributed. A total of 129 data points were analysed to answer the study question and sub-questions, as well as provide recommendations for the industry and future research.
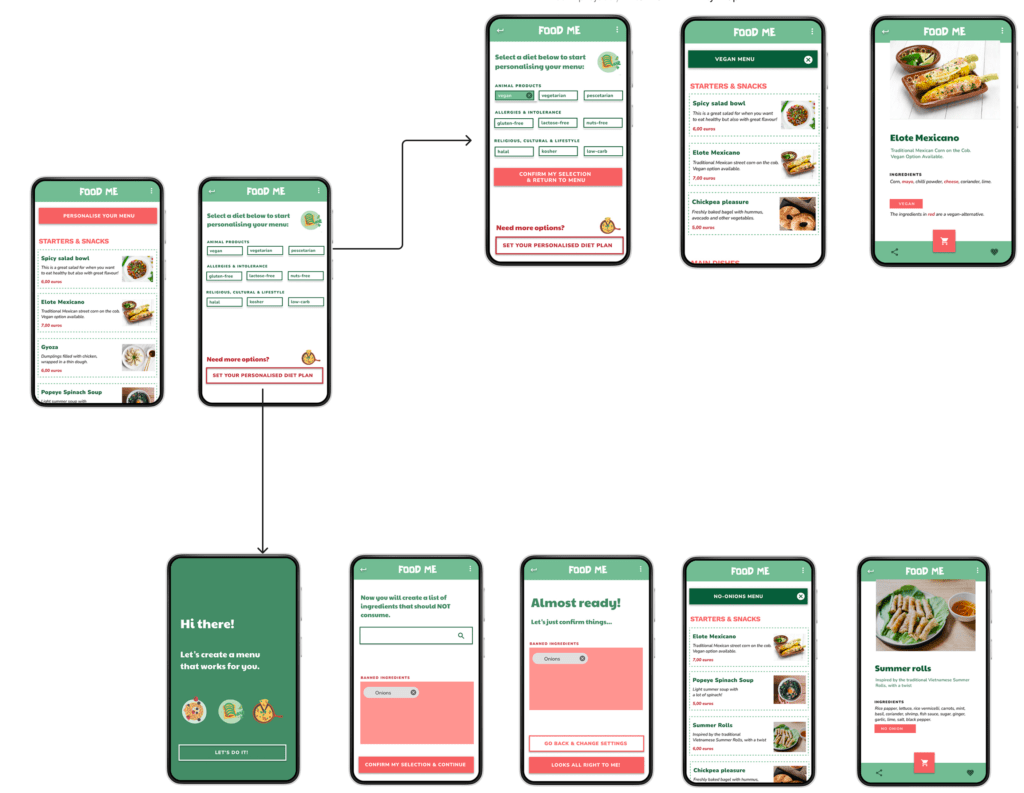
Prototype of a digital menu
The prototype was developed in Figma and it can be accessed on this link. It contains a total of 90 screens for user navigation, and it considers five cases of dietary requirements:
- Restrictions based on health concerns (represented by a gluten-free diet);
- Restrictions based on religion and culture (represented by a halal diet);
- Restrictions based on personal preferences (represented by a vegan diet);
- Restrictions based on an ingredient (represented by dishes without onion);
- Restrictions based on a combination of an allergen health concern and an ingredient (represented by a gluten-free diet that also excludes onion).
Data Analysis
While the original document details all the steps involved in the data analysis, a summary of the steps I took is described below:
Qualitative data – Interviews
- Participants’ responses were coded according to their diet type.
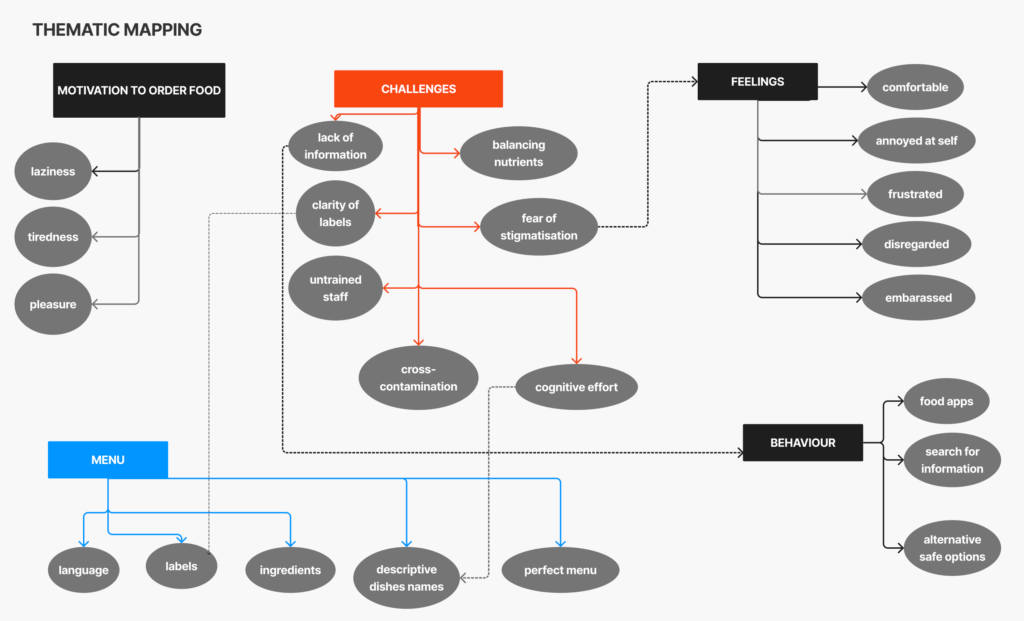
- Thematic analysis was conducted with the data from the interviews. I followed the six-step framework proposed by Braun and Clarke (2006). A total of five themes emerged.
- The report with themes, codes and participants’ quotes was created.
Quantitative data – Survey
- Ensured data integrity by cleaning and processing data in Google Sheets (duplicates, incomplete responses and diets that could not be classified were removed).
- Participants’ responses were coded according to their diets.
- Created dummy variables for total scores of Consumer Trust, Intention to Recommend Self-Concept, and Information Value. These scores are calculated as the means of their respective scales, except for Self-Concept, which is calculated based on the Euclidian distance between the real and experienced self.
- Imported data to SPSS.
- Initial tests for reliability for all the scales used in the study are based on Cronbach’s Alpha.
- Kolmogorov-Smirnov tests were performed to verify if computed scores values follow a normal distribution. This step is crucial to deciding on the appropriate types of tests used for inferential statistics.
- Spearman correlations tests looked to identify possible associations between variables.
- Several regression tests were conducted to test the predictiveness of Consumer Trust and Intention to Recommend.
- Mann-Whitney and Kruskal-Wallis were performed in order to identify if there are statistically significant differences in responses between groups.
- The data was organised according to K-means clustering for verifying patterns among cluster items.
THE RESULTS
The key results of this project show that establishments that make and serve food and beverages can improve the information disclosed in their menus, increasing the trust of consumers with special diet needs.
A combination of labels with detailed ingredient information has been shown to be an appropriate alternative to enhance menu information. Accordingly, when interacting with a digital menu that provides both types of information, most individuals reported a positive user experience.
The study shows that there is a strong association between the information value provided by the detailed ingredients list of menu items with consumer trust. At the same time, the link between consumer trust and willingness to recommend the restaurant to others has a strong relationship, whereas a menu that conforms to consumers’ expectations has a moderate association with consumers’ trust in the restaurant.
No significant differences in the responses between groups has been observed.
SUMMARY OF THE RESULTS
| SQ1: What types of challenges do young individuals with dietary requirements experience when ordering food? | The main challenges found were clarity of labels, lack of information, high cognitive effort, fear of stigmatisation, balancing nutrients and cross-contamination. |
| SQ2: How do young people with dietary requirements describe their expectations regarding information disclosed in digital menus? | Individuals expect that a digital menu follows four primary directives: use of symbols or labels, considerations with language options, clarity on dishes ingredients and use of descriptive dish names. |
| SQ3: How do young individuals with dietary requirements describe their expectations concerning a digital menu that lists dish ingredients? | Individuals expect that a clear list of ingredients would help them make more confident food choices; however, they still report the need for additional information, such as labels for allergens, the origin of meat ingredients and clarity around cross-contamination. |
| SQ4. How do young individuals evaluate their experience when using a digital menu that lists the ingredients of a dish while allowing personalization according to diet types? | Most participants (85%) report an overall positive experience with the digital menu based on their scores for Self-Concept. |
| SQ5: Are there differences in responses between the groups representing the three types of dietary requirements investigated in this research? | No statistically significant differences in responses have been observed among participants who interacted with the digital menu. Likewise, responses were consistent among interviews, with prominent mention of allergens among individuals with health conditions and the use of certification labels for meat provenance by participants with a religious-based diet. |
| H1: A digital menu that conforms to consumers’ expectations will positively influence consumers’ trust in a food establishment. | There is a moderate association between Self-Concept and Consumer Trust (r=-.36, p<.001). |
| H2: Self-Concept and Information Value have a statistically significant relationship. | The association between Self-Concept and Information Value is weak for the sample used in this study (r=-.25, p<.05). |
| H3: Self-Concept and Information Value are strong predictors of Consumer Trust. | Information Value is a predictor of Consumer Trust, albeit Self-Concept is not. Information Value (Beta = .735, t(116) = 11.63, p < .001) significantly predict the value of Consumer Trust with explanation power of approximately 54% (F(1, 116) = 135.40, p < .001, R2 = .541). |
| H4: Intention to Recommend can be predicted by Self-Concept, Information Value and Consumer Trust. | Self-Concept, Information Value and Consumer Trust can be used to predict Intention to Recommend. Self-Concept (Beta = -.204, t(115) = -3.42, p < .001), Consumer Trust (Beta = .309, t(115) = 3.68, p < .001), and Information Value (Beta = .454, t(115) = 5.41, p < .001) predict the value of Intention to Recommend with approximately 65% of explanation power (F(3, 112) = 68.68, p < .001, R2 = .648). |
| H5: Intention to Recommend and Consumer Trust have a strong positive association | There is a strong positive association between Intention to Recommend and Consumer Trust (r=.70, p<.001). |
CONCLUSIONS & RECOMMENDATIONS
For the industry
Food businesses can significantly benefit from accommodating the information needs of consumers with special dietary concerns. By providing descriptive menus restaurants are more likely to gain consumer’s trust, which is linked to one’s intention to recommend the establishment.
A detailed list of ingredients is the start point for ‘smart menus’ that allow sophisticated personalisation options. Menu engineering is a “hot topic” for the hospitality industry, although most applications so far are implemented with the intention to favour the business rather than the user.
Listing ingredients can potentially benefit a company’s website, especially when search engines are moving from keyword to semantic search algorithms. Moreover, with the increase in the use of artificial intelligence applications and internet of things, the relevance of providing information along semantic markup can help “smart agents” understand which menu items fit within one’s diet.
Food apps can improve their interface considerably by giving restaurants the option or requirement to provide ingredient information for their dishes, and so implementing filter options and personalisation accordingly.
suggestions for future investigation
Extend the sample size to verify results, particularly among groups with diets related to religion and culture.
Use alternative measures for Consumer Trust and UX, so as to compare the results with the ones reported in this study.
Further investigate which types of usability improvements can be of added value to populations with dietary requirements.
Compare different versions of digital menus among groups with special diet needs.
PRESENTATION DECK
WHAT I LEARNED
This project allowed me to get more comfortable in running interviews by myself, while exploring alternative methods I had not used so far, such as instant messaging interview.
However, what I have truly enjoyed was being able to sharpen my knowledge of statistics. It has been a challenge to review concepts I have not used for a long time, while learning so much along the way… As it usually goes within statistics, I heard a lot “it depends” from my supervisor, which would bring initial confusion and frustration. Nevertheless, seeing the results shaping form over the weeks brought me profound joy.
Last, I was also very curious about exploring the method of Self-Concept as a measurement of UX ????